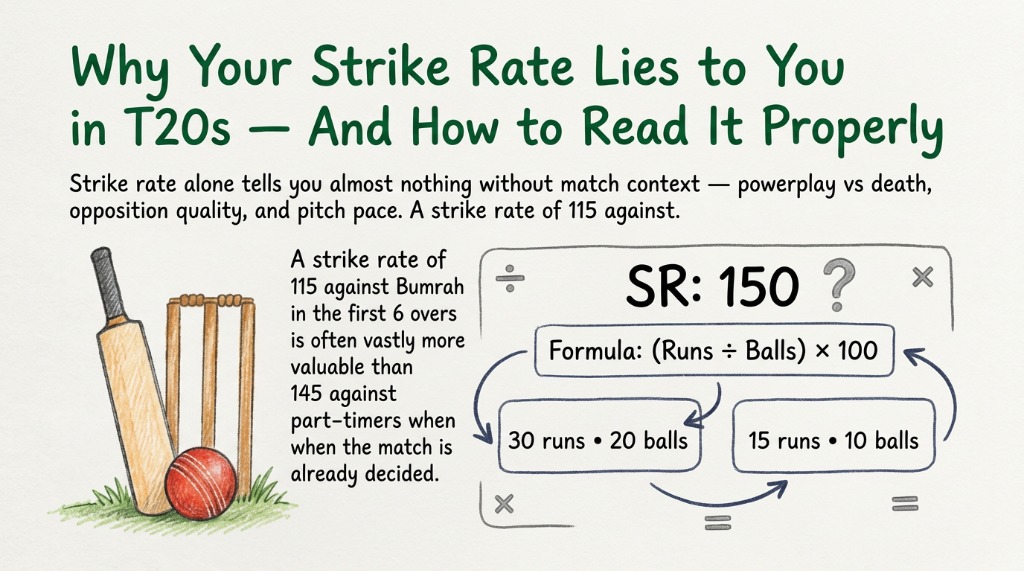
Strike rate (SR) measures scoring speed — runs per 100 balls faced. The formula is straightforward. What is
not straightforward is what the number actually tells you about a batting performance.
Context collapses the meaning of a raw SR figure. An SR of 108 against a quality seam attack in the
powerplay, on a green pitch, is a more valuable innings than an SR of 145 against a part-time spinner in the
death overs with the field spread. The stat is the same arithmetic either way; the cricket situation is
entirely different.
The three things SR cannot tell you on its own: how difficult the pitch was playing, what the team's score
required at that point, and how many wickets were preserved for later. A batter who scores 42 off 50 balls
and holds the innings together through a collapse has done more than one who scores 30 off 20 balls and gets
out at a critical juncture.
In T20 cricket, what benchmarks apply? A powerplay SR above 130 is generally considered strong. Between 100
and 130 is acceptable depending on conditions. Below 90 in the powerplay, without wickets falling around you
as justification, is a genuine drag on the innings. In the death overs (overs 17–20), expectations shift —
anything below 140 from an established batter is typically suboptimal unless the team is well ahead.
Hypothetical scenario: Batter A scores 36 off 28 balls (SR 128.5). Batter B scores 20 off
12 balls (SR 166.6). If A came in at 2 wickets down in over 5, and B came in at 1 wicket down in over 16, a
higher SR for B tells you almost nothing useful about relative quality.
Formula: (Runs ÷ Balls Faced) × 100
The Duckworth-Lewis-Stern (DLS) method has been the ICC's official approach to rain-affected limited-overs
match targets since 1997, replacing the inferior average run rate method that produced several controversial
results. The method was developed by statisticians Frank Duckworth and Tony Lewis, later refined by Steven
Stern.
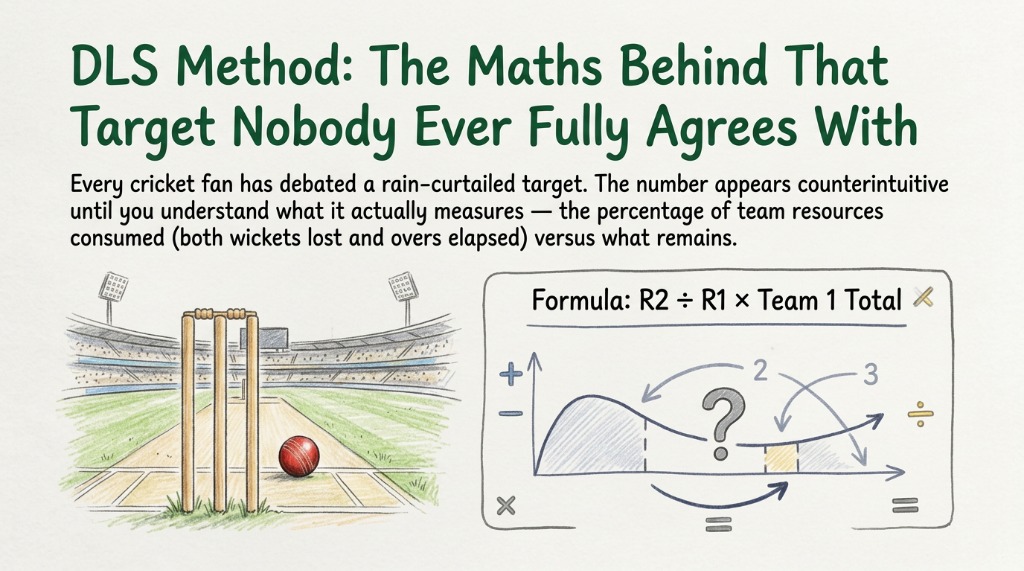
The core idea: a batting team has two resources — wickets in hand and overs remaining. DLS quantifies the
percentage of total match resources a team has available at any point. When rain interrupts, it calculates
what percentage of resources Team 2 has lost compared to Team 1, and adjusts the target accordingly.
Why does the target sometimes seem low or high? Because losing overs in the early stages of a chase is less
damaging to resources than losing them in the death, and losing wickets dramatically reduces the available
resource percentage. A team chasing that has already lost 5 wickets by over 20 has far fewer resources than
a team with all 10 wickets standing at the same point — the DLS table reflects this, which is why targets
can feel unintuitive.
One commonly misunderstood rule: if Team 1 is interrupted and their innings is curtailed, their par score
is set and Team 2's target is calculated off that. If Team 2 is interrupted mid-chase, the target is
recalculated based on their resource position at the time of interruption — not their original target.
Important limitation: the ICC's official DLS resource tables are proprietary and not publicly available in
full. Any online tool, including ours, uses a simplified version of the Standard Edition tables. Results
will be close but should not be used for official match decisions.
Hypothetical scenario: Team 1 scores 260 in 50 overs. Rain cuts Team 2's innings to 40
overs before they start. If Team 2's resource percentage is 89.3%, the revised target is approximately 233
(260 × 89.3% ÷ 100, rounded up). This is an illustrative calculation — actual DLS software applies more
granular interpolation.
Formula: Target = Team 1 Score × (Team 2 Resources % ÷ Team 1
Resources %)
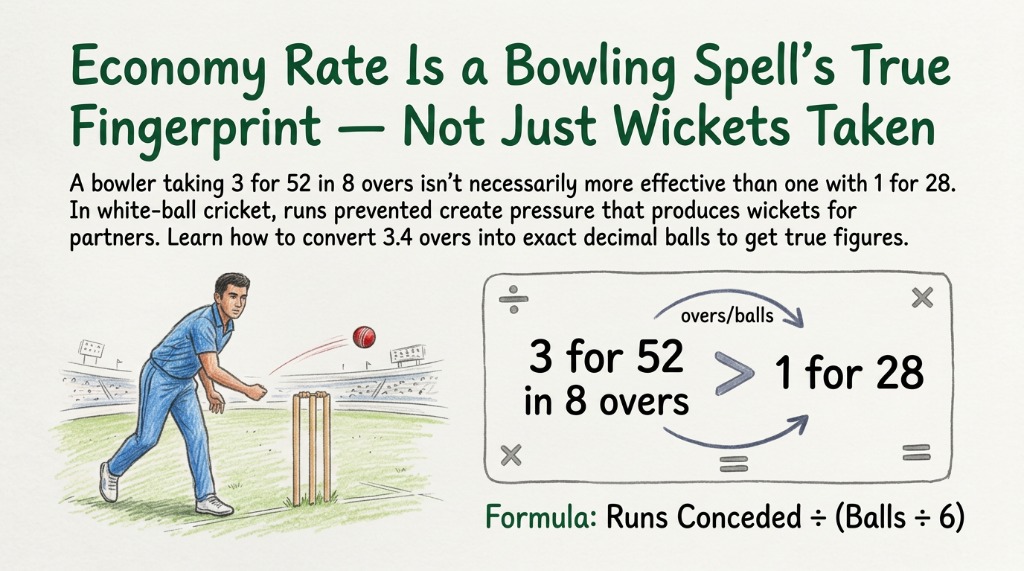
Economy rate (ER) is the number of runs a bowler concedes per over. Unlike wickets, which are discrete
events spread unevenly across a spell, economy rate is continuous — it accumulates with every delivery and
reflects sustained pressure or its absence.
In white-ball cricket, a bowler who concedes 28 runs in 4 overs (ER 7.00) without taking a wicket may have
contributed more than one who takes 2 wickets but concedes 44 (ER 11.00). The runs are permanent; the
wickets created an opportunity, but at a cost that often negates the impact.
One cricket-specific calculation error that trips people up: overs notation. "8.3 overs" does not mean 8.3
in decimal terms. It means 8 complete overs and 3 additional balls, which is 51 balls total, or 8.5 decimal
overs. Dividing by 8.3 instead of 8.5 produces a slightly incorrect economy figure. The correct conversion:
decimal overs = complete overs + (extra balls ÷ 6).
What counts as a good economy rate varies sharply by format. In T20 international cricket, an economy below
7.00 is considered excellent. Between 7.00 and 8.50 is solid. Above 9.00 in T20 becomes a significant
liability. In ODIs, the benchmark shifts: under 4.50 is exceptional, 5.00–5.50 is good, and above 6.50
becomes expensive for a specialist bowler. Test cricket benchmarks are different again — a Test economy of
2.50 to 3.00 per over is typical for quality spells.
Hypothetical scenario: A bowler concedes 38 runs in 7.4 overs in a T20 match. Decimal overs
= 7 + (4 ÷ 6) = 7.667. Economy rate = 38 ÷ 7.667 = 4.96 — which would be outstanding for a T20 spell, though
unusual for a full T20 game where a bowler typically bowls 4 overs maximum.
Formula: Runs Conceded ÷ Overs Bowled (where Overs = complete overs +
extra balls ÷ 6)
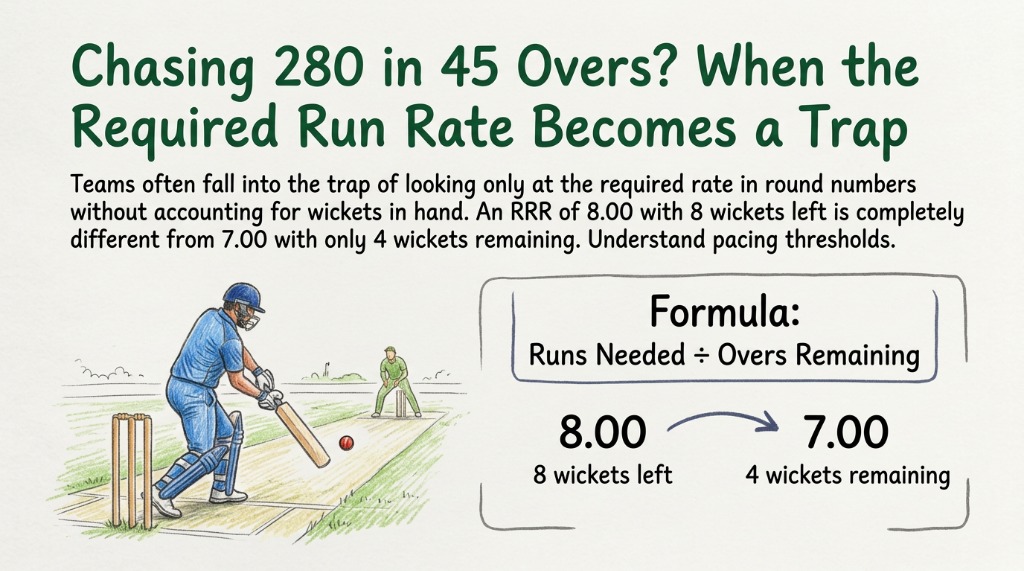
Required run rate (RRR) is calculated by dividing runs needed by overs remaining. It is the simplest live
match calculation in cricket. It is also one of the most commonly misread.
The trap is treating RRR as a fixed ceiling to stay below, rather than a dynamic figure to manage alongside
wickets in hand. A team needing 6.5 runs per over with 8 wickets in hand at over 20 is in a strong position.
The same RRR with 4 wickets at over 35 is a crisis — the asking rate looks the same, but the resource
picture is entirely different.
RRR compounds when wickets fall in clusters. If a team is 3 wickets down and scoring at the required rate,
and then loses 2 more wickets in 3 overs while those overs pass, the RRR jumps sharply — not just because
runs weren't scored, but because fewer wickets remain to score them. This is why chasing teams sometimes
look comfortable on RRR and collapse simultaneously.
A practical T20 watch-guide: if the chasing team's RRR exceeds 12 with fewer than 6 wickets in hand, the
match is effectively won by the fielding team in most conditions. If RRR is below 7 and 7+ wickets remain
with 8 or more overs to go, the chase is nearly over. The interesting zone is 9–11 RRR with 5–7 wickets —
that's where matches are genuinely contested.
In ODIs, the inflection point is different. An RRR climbing above 8 past over 35 with fewer than 5 wickets
is historically very difficult to sustain across an innings, even for strong batting sides.
Hypothetical scenario: Chasing 240 in a T20, after 14 overs the batting team has scored 98
for 4. Runs needed: 142. Overs remaining: 6. RRR = 142 ÷ 6 = 23.67. The chase is over regardless of how
promising the RRR looked at over 10.
Formula: Runs Needed ÷ Overs Remaining
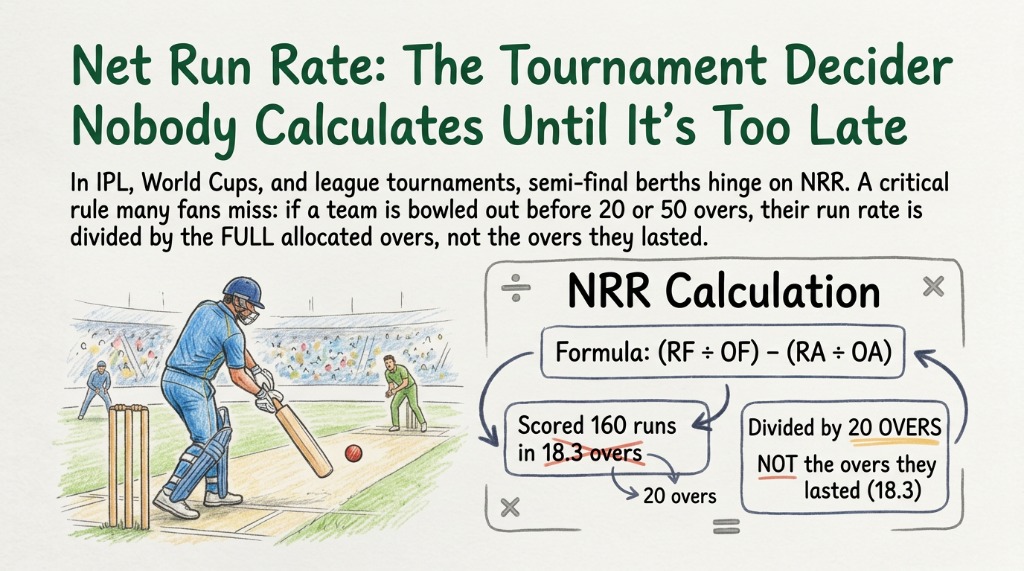
Net run rate (NRR) is the tiebreaker used in group-stage cricket tournaments when two or more teams finish
level on points — including the ICC Cricket World Cup, ICC T20 World Cup, and the IPL. It is calculated as a
team's average runs scored per over across all group matches, minus their average runs conceded per over
across all those same matches.
The calculation that most fans miss: when a team is bowled out before their allocated overs are completed,
their run rate for that innings is calculated against the full quota of overs — not the overs they actually
batted. A team bowled out for 120 in 28 overs in an ODI has their run rate calculated as 120 ÷ 50 = 2.40,
not 120 ÷ 28 = 4.28. This significantly depresses NRR and is the main reason winning by runs (batting first)
can be more NRR-friendly than winning by wickets.
The opposite also applies: when a team bowling dismisses the opposition cheaply and early, the conceded
rate is calculated over the full overs — giving them a much better conceded-side NRR. This is why teams
sometimes deliberately bowl quickly in the final stages of a group match rather than taking time between
overs.
To improve NRR: bat first and win by a large margin without being bowled out, or bowl second and dismiss
the opposition as early as possible. Winning a chase, particularly a close one, does relatively little for
NRR because the batting team uses most of the available overs.
Hypothetical scenario: Across three group games, Team A scores 520 runs in 148.2 overs and
concedes 430 runs in 150 overs. Decimal overs for scored = 148 + (2÷6) = 148.33. Run rate scored = 520 ÷
148.33 = 3.505. Run rate conceded = 430 ÷ 150 = 2.867. NRR = 3.505 − 2.867 = +0.638.
Formula: (Total Runs Scored ÷ Total Overs Faced) − (Total Runs
Conceded ÷ Total Overs Bowled)