Powerplay, middle overs and death overs: how to read T20 phase run rates
A single run rate hides the shape of a T20 innings. This guide splits a fictional innings into its three phases, shows how to calculate each rate and explains why the phases differ.
By CricketCals · Published 14 October 2026 · Updated 14 October 2026
A T20 innings lasts 120 balls, but those balls are not equal. The first six overs are played with tight fielding restrictions, the middle overs are about building and rotating, and the last few overs are a sprint. A single innings run rate averages all of that together and hides where the runs actually came from.
Splitting the innings into phases gives a much clearer picture. This guide shows how to do it, using a fictional innings, and explains the rules that make each phase different.
The three phases
Analysts draw the boundaries in slightly different places, so this guide uses a common split:
- Powerplay: overs 1 to 6. Under standard international T20 conditions, no more than two fielders may be outside the 30-yard circle, so boundaries are easier to find.
- Middle overs: overs 7 to 15. Up to five fielders may be outside the circle. Spin bowling is common, and batters often look to rotate strike and rebuild.
- Death overs: overs 16 to 20. The restriction is the same as the middle overs, but the pressure of the finish changes how both sides play.
Fielding restrictions are set by each competition’s playing conditions, so check your own event before relying on the details above.
A worked innings
Here is a fictional innings of 168 for 6, split by phase. The rate in each phase is that phase’s runs divided by its overs.
| Phase | Overs | Runs | Wickets | Run rate |
|---|---|---|---|---|
| Powerplay (1 to 6) | 6 | 52 | 1 | 8.67 |
| Middle (7 to 15) | 9 | 70 | 3 | 7.78 |
| Death (16 to 20) | 5 | 46 | 2 | 9.20 |
| Whole innings | 20 | 168 | 6 | 8.40 |
The whole-innings rate of 8.40 hides a clear shape. The side scored faster than average in the powerplay, slowed in the middle overs while losing three wickets, and then accelerated at the end. Nothing in the single figure reveals that the middle overs were the weak phase.
To check the phase figures yourself, add the runs and overs separately: 52 + 70 + 46 = 168 and 6 + 9 + 5 = 20. If the phase totals do not match the innings total, a window has been mis-counted.
Phase economy for bowlers
Bowlers’ phase figures use the same approach. Imagine a bowler delivers two overs in the powerplay for 11 runs and one over at the death for 14. In the powerplay the economy is 11 ÷ 2 = 5.50. At the death it is 14.00. Combined, the three overs cost 25 runs: 25 ÷ 3 = 8.33.
That combined figure would make the bowler look ordinary, while the phase breakdown shows a good powerplay and a costly final over. A captain choosing who bowls the 19th over would care about the second number far more than the first. Add runs and balls before dividing, and keep each phase’s denominator in balls, as explained in the overs guide.
Do not project the whole innings from the powerplay
It is tempting to take the powerplay rate and extend it: 52 off six overs is 8.67 an over, and 8.67 × 20 is about 173. That arithmetic is correct and the conclusion is not reliable. The side finished on 168 here, but a different pattern of wickets would give a very different total. A side that loses three wickets in the powerplay will not keep scoring at the same pace, and a side with eight wickets in hand can score much faster at the end than at the start.
For a more careful approach, read the projected score guide, which uses ranges of possible scoring rates rather than a single straight-line forecast.
Phases in a chase
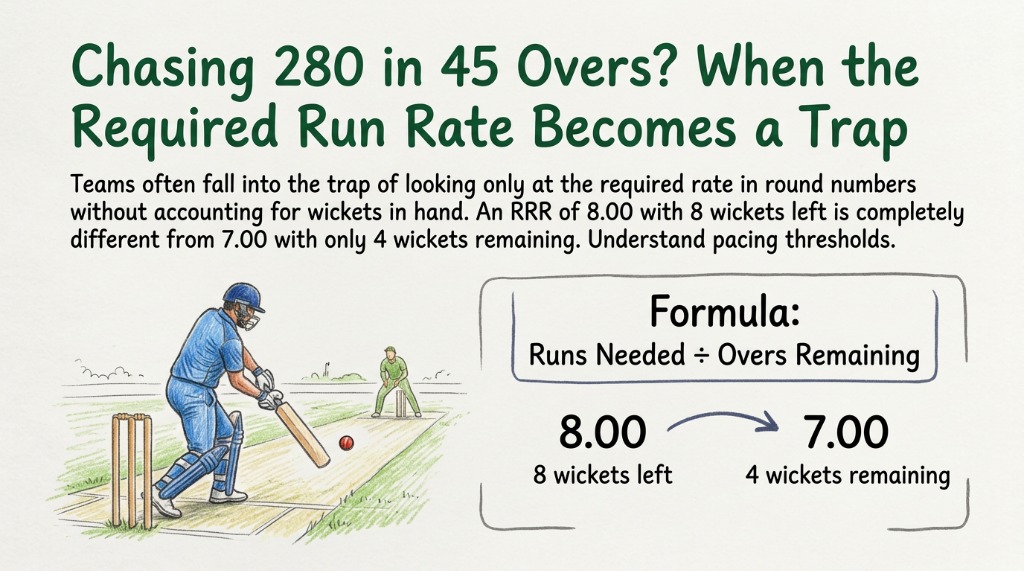
When chasing, the same phase split shows whether the side is ahead or behind its required rate at each stage. A target of 169 needs 8.45 an over across 20 overs. If the powerplay produces 52, the rest of the chase needs 117 from 14 overs, a required rate of 8.36. The pressure moves from the early overs to the later ones, and the required run rate guide shows how to recalculate it after every over.
Caveats
Phase statistics are descriptive, not predictive. They depend on the quality of the opposition, the pitch, the dew and the match situation. A weak powerplay in a rain-shortened match may be a deliberate plan. Treat the numbers as a starting point for questions, not a verdict.
Practice questions with answers
Try these on your own first, then compare with the answers.
Question 1. An innings has 48 for 2 in overs 1 to 6, 62 for 1 in overs 7 to 15 and 60 for 3 in overs 16 to 20. What are the phase rates and the overall rate?
Answer. Powerplay 48 ÷ 6 = 8.00. Middle 62 ÷ 9 = 6.89. Death 60 ÷ 5 = 12.00. Overall 170 ÷ 20 = 8.50.
Question 2. A bowler concedes 7 in one powerplay over, 15 in two middle overs and 17 in one death over. What is the economy overall?
Answer. 39 runs from 4 overs: 9.75.
Question 3. A side chasing 177 scores 55 in the powerplay. What rate does it need for the remaining 14 overs?
Answer. Runs needed 122 from 84 balls: 122 × 6 ÷ 84 = 8.71.
Check your own figures
Use the run rate calculator on each phase separately: enter the runs and overs for that window instead of the whole innings.
Open the Run Rate calculatorQuestions readers ask
How many overs are in the T20 powerplay?
Six, the first six overs of the innings, under standard international T20 playing conditions. Check your event, as club and domestic competitions can differ.
What counts as the death overs?
Usually the last four or five overs of a T20 innings. Different analysts use different cut-offs, so state the window you use.
Why do the three phase rates not average to the innings rate?
Because the phases have different numbers of overs. Add runs and overs separately, then divide. Averaging the three rates gives each phase equal weight regardless of length.
Can I use the run rate calculator for phases?
Yes. Enter the runs scored and the overs faced for that phase only.
How this guide was checked
Published by CricketCals. Every match, score and player in this guide is a fictional teaching example, so you can reproduce each answer from the figures shown. Calculations keep full precision until the final rounding. If a published scorecard or a competition rule disagrees with a figure here, the official record and the event's playing conditions take priority. You can send a correction with the figures and the rule you used.
- ICC playing conditions: Standard T20 conditions, including powerplay fielding restrictions.
- MCC Laws of Cricket: Law 17 defines the over.